
Introduction
This post details my investigation of implicit bias in the famous “Census-Income dataset”, in which we examine to what extent Individual Fairness is upheld in the model, and to what extent the dataset and the methodology chosen impact fairness.
I chose to create a Random Forest Classifier using the Scikitlearn toolkit. I elected to use this primarily because of its flexibility with respect to handling different types of data. The Census-Income dataset is made up of continuous and categorical information, so opting for a Random Forest Classifier reduces the required pre-processing of the dataset.
The two protected attributes I chose to analyze are “sex” and “race”. Despite society being cognizant of sexism and racism for far longer than other forms of discrimination, these types are still ever present in the modern world. “Almost half of people of African descent in the EU face racism and discrimination in their daily life” and gender parity targets being missed globally are just a couple examples which show the extent of these societal problems.
I decided to omit all protected attributes from the model-building process. This approach is based on the rationale that by eliminating any ‘Formal’ unfairness or bias associated with these attributes, it becomes easier to identify and address any implicit biases that might exist.
The Scikit-learn Random Forest Classifier offers a range of hyperparameters that can be adjusted. For this study, since the primary focus isn’t on optimizing model performance, I limited the hyperparameter tuning to the two most impactful parameters: the number of Decision Trees in the Random Forest and their maximum depth. I conducted a grid search across powers of 2, ranging from 21 to 210 for both parameters. Following this, a linear search was performed within the identified range, which determined the optimal values to be 323 for the number of Decision Trees and 20 for their maximum depth.
Individual Fairness
Individual Fairness in machine learning refers to the concept that similar individuals should be given similar outcomes. To measure Individual Fairness in the Random Forest classifier, one must measure the extent to which the classifier complies with the rational that individuals should receive similar outcomes.
Analysis Structure
To analyze individual fairness within my Random Forest classifier, I implemented a methodology where each entry in the test dataset was paired with another record that exhibited the highest similarity to it. This pairing was based on the entire feature vector, ensuring that the two records in each pair were as alike as possible. To achieve this, I employed a cosine similarity measure, which effectively quantifies the likeness between two multidimensional data points.
Once these pairs were established, I subjected both records in each pair to prediction by my classifier. The rationale behind this step was to assess whether the classifier’s decisions were consistent for similar instances. In cases where both records in a pair received the same classification outcome, I interpreted this as an indication of fairness, marking these instances with a ‘Correlated’ value of 1. Conversely, if the classifier predicted different outcomes for the two closely matched records, I assigned a ‘Correlated’ value of 0, signaling a potential issue in fairness.
Once all of these records were processed, I then cross-referenced them by the sensitive attributes I have chosen to investigate, to determine the likelihood of Individual Fairness being violated with respect to the values of the sensitive attributes.
Analysis of Results
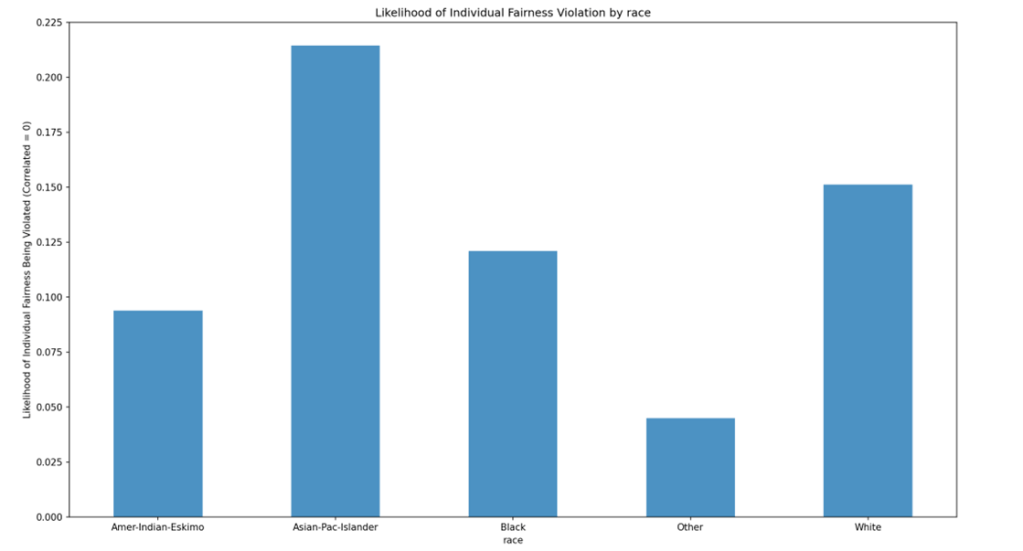
The model aligns with the Individual Fairness Principle in 85% of cases. At first glance, this substantial adherence rate might suggest a robust fairness in the model’s decisions. However, a closer examination of specific demographics reveals underlying disparities. Notably, a significant deviation for Asian-Pacific Islanders, who are 7% more likely to experience violations of Individual Fairness than the general population (15%). This discrepancy is particularly concerning given the comparative scarcity of Asian-Pacific Islander records (196) against a backdrop of 5540 records for White individuals, who match the general population’s violation rate. Such a disparity raises questions about potential biases introduced by imbalances in the dataset’s demographic representation.
There is gender-based imbalance in the application of the Individual Fairness Principle. Men are 5% more likely to encounter fairness violations than women. This is probably due to the oversampling of males to females, which inherently increases the likelihood of fairness violations within the group.
Cause of Unfairness
Dataset Unfairness
Machine learning relies on patterns and generalizations attained from the dataset to make predictions, therefore if the dataset used to train a model is skewed or biased against groups or individuals there is a risk of these biases being propagated to the model. To ensure that this does not occur, it is important to identify the unfairness/bias in the dataset.
The Chi-square test effectively detects bias or significant associations between categorical variables like sex or race and outcomes such as income class. After performing these tests, both sex and race exhibit statistically significant relationships with income class, suggesting that these attributes may influence or correlate with income disparities. This inference is further supported by the disproportionate representation of income classes across different sexes and races. This skew in the dataset compromises Individual Fairness by predisposing the model to make biased decisions, where similar individuals are treated differently due to overrepresented characteristics, leading to unequal and potentially discriminatory outcomes. Group fairness is also impacted as the skew may cause the unequal treatment of demographic groups.
When evaluating dataset unfairness, it is important to evaluate the context in which the data was collected. The “Adult dataset” was collected by the United States Census Bureau in 1994. According to the CDC’s statistics, there were more females than males in the USA at the time, which contradicts the Adult dataset, which reports more men. This bias in data collection significantly undermines the relevance and applicability of the resulting dataset.
Model Unfairness
For this investigation, the Random Forest Classifier was selected, leveraging Decision Trees in an ensemble approach, with an underlying assumption that the dataset contains a diverse representation of classes (class diversity) to avoid bias in predictions. However, as previously discussed, the dataset does not sufficiently represent all classes, leading to an unfair model. The underrepresentation of certain classes can significantly impact the model’s fairness, resulting in biased predictions.
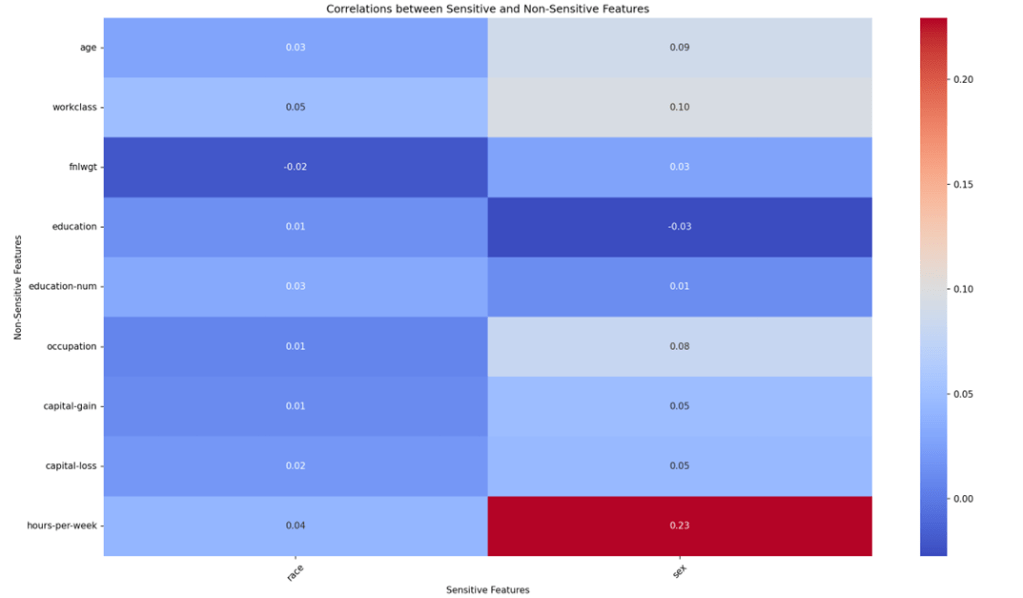
The correlation matrix shows clear correlation between a person’s sex and many of the “non-sensitive” features. These correlations could be implicitly learned by the model, leading to sex discrimination, despite the sex feature never being used in the models training. In fact, classifying for sex instead of income-class using only the “non-sensitive” features produces a model with an F1-Score of 0.821 and an Accuracy of 0.748, which means these “non-sensitive” features are much more useful in predicting sex than income-class. This demonstrates and quantifies the extent to which these features are correlated with sex, and how a Random Forest model learns these correlations, to the detriment of fairness.
Varying the hyperparameters of the model when classifying on the sex feature showed no real variation in the F1-Score, which indicates that varying the hyperparameters has little to no impact on the correlation effect.

Leave a comment